Trading Down: The Majority of MLB Trades This Year Have Backfired For Contenders
This article appeared in The Cauldron | Sports Illustrated on September 1, 2016.
Baseball players, on the whole, are traded far more often than their peers in football and basketball combined (the NHL nearly matches MLB in trade count). Since the start of the 2016 MLB season, there have been 64 trades involving 29 franchises and over 150 players. (Apparently, the Colorado Rockies feel pretty good about things at 62–68 and have chosen to sit this year out on the trade front.) Conversely, only 49 NBA and NFL players changed teams via trade during their respective regular seasons in the past year.
But all that wheeling and dealing doesn’t always achieve the desired results.
Catcher Jonathan Lucroy has seen his already-great numbers improve after moving from Milwaukee to Texas in late July. His OPS+ (on-base + slugging percentage relative to the rest of the league, adjusted for ballpark factors, where 100 is average and higher numbers are better) has jumped 20 points, from 121 with the Brewers to 141 as a Ranger. But Lucroy is in the minority among those who have changed teams this season.
Starting pitcher James Shields has had a horrific time since heading to the White Sox earlier this year. He’s just 3–9 with a 7.49 ERA and 1.77 WHIP with Chicago. And how does one account for outfielder Josh Reddick suddenly forgetting how to hit after heading down the 405 to Dodger Stadium (.145 batting average, no home runs, no RBI in 89 plate appearances)?
This year, nearly half of the Major Leaguers to change clubs mid-season have played for both their former and new teams this year (as opposed to those who may have been promoted from the minor leagues after they were dealt). Narrowing the pool down to these 70 players (25 batters, 45 pitchers) allows for a comparison to be made between their numbers before and after they were moved.
The position players in this subset have collectively seen their OPS decline from .734 prior to their transactions to .676 following them. Removing those with extremely small sample sizes — i.e., any player with 10 or fewer games on their new teams — yields a spread of over 100 points for the remaining 18 hitters, .776 to .671. Since joining their new teams, these batters have collectively compiled a negative WAR (a measure of the number of wins a player adds over what a replacement player would contribute) and have seen a 24.6 percent decrease in their home run rates.
The bigger names have not been immune to this trend; they have actually seen their performances drop off the most precipitously. Of the six players on this refined list with at least one All-Star appearance during their careers, their post-trade OPS is an astounding 157 points lower on their new teams than it had been this year prior to changing rosters. (Lucroy’s is the only one to have improved.)
The group’s home run rate has plummeted 35 percent from 27.1 long balls per 600 plate appearances earlier in the season to 17.6 since the respective trades. All six former All-Stars had an OPS+ above 100 prior to their deals; among them, only Lucroy’s has been above 100 after switching teams.
The drop in production has not been isolated to hitters. Starting pitchers have seen a similar trend after they’ve been dealt this year. There have been 17 traded starters who have played for both their former and current teams this season and their collective ERA has swelled from 4.46 pre-trade to 5.61 post-trade. They are allowing 12.3 percent more baserunners than before, and they are striking out 10 percent fewer batters per nine innings.
All of that has led to a surprisingly sharp decline in the starting pitchers’ winning percentage from .472 (83–93) prior to the deals to just .328 (21–43) after they were sent to their new teams. And while wins and losses are heavily team-dependent and, therefore, can often be poor indicators of how well a pitcher has performed, the stat is telling because of the dynamics behind MLB trade strategy.
Teams that are in contention for a playoff spot tend to acquire good players, not trade them off. So it stands to reason that if a pitcher moves from a lesser squad to a superior one, the impact on his record should be positive. Of the 17 hurlers on this list, 14 of them (82.4 percent) were sent to better teams, based on overall record. And yet, despite playing for better teams, their winning percentage is over 140 points worse than it had been prior to their deals.
As is the case with the batters above, the pitchers with the better resumes are the ones who have fallen off the most. The six starters who have been All-Stars at some point in their careers have a post-trade ERA of 6.19, which represents a nearly two-run increase over their 4.28 pre-trade ERA. Their winning percentage spread is even larger than the initial group’s. The All-Star pitchers had won 47.6 percent (40–44) of their games before they were dealt and just 26.7 percent (8–22) afterwards. Five of the six All-Star hurlers on the list are playing for better teams since their trades, yet they are inexplicably losing more frequently.
One possible theory for this phenomenon is that players often inflate their values when they over-perform early in the season. Teams chase the hot bat and live arm. Why would they pursue someone who is having a horrible season? Intuitively, it makes sense to see big numbers and dream about how they’d look when they’re added to your roster. But for every athlete who is able to maintain an outlier season for an extra month or two, there are several who succumb to basic mathematics. It is foolish to expect such dominating numbers over a full 162-game schedule and the teams that trade for these players must then bear the brunt when regression knocks on the door.
One example of this is reliever Fernando Rodney.
Through 28 2/3 innings with the Padres this year, Rodney had a video game-like ERA of 0.31 and his WHIP sat at an impressive 0.8721. Since being traded to Miami, he’s pitched nearly the same number of innings (27 1/3), but his other stats have changed in a major way. Rodney’s ERA with the Marlins is 3.95, while his WHIP has nearly doubled from his time in San Diego to 1.5366. For the season, his ERA is 2.09 and his WHIP is 1.196; both figures are well below his career averages. So while his overall year still looks strong, there was just no way Rodney was going to be able to maintain anything close to his pre-trade numbers for the duration of the regular season.
Jay Bruce presents a similar, though not as extreme, example on the offensive side. When he was sent from Cincinnati to the Mets this year, he had a 126 OPS+, which was not only a career high, but it represented an enormous leap from last year’s 97 OPS+ and the 82 OPS+ he posted the year before that. For the season, Bruce’s OPS+ is 110, which is right in line with his career mark of 109. Unfortunately for New York, while his full-season stats appear normal, it required an OPS+ of just 39 through his first 94 plate appearances with his new team to get there.
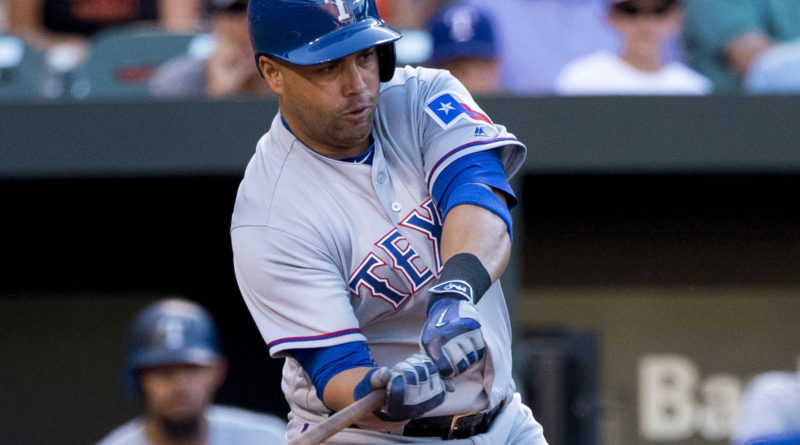
Carlos Beltran (OPS+ of 132 pre-trade and 54 post-trade) and Drew Pomeranz (ERA+ of 165 pre-trade and 113 post-trade) have also posted large splits that have resulted in full-season numbers that are much more typical of their careers.
However, as a group, the 70 players from above were not outperforming their career arcs prior to being dealt. Specifically, the vast majority of position players and starting pitchers are simply struggling with their new teams.
The 25 batters’ collective numbers from 2015 are nearly identical to their pre-trade stats this year. But since they were dealt, their batting average, on-base percentage and slugging percentage have all declined significantly. With their new teams, they have as many combined Wins Above Replacement as most of you reading this.

While the 17 starting pitchers on the list were actually slightly worse earlier this year than they were a year ago, many of them completely fell apart once they changed jerseys. Since 1970, only five MLB teams have finished a season with a winning percentage below this group’s post-trade rate of .328. And these are pitchers who were mostly acquired by playoff-contending clubs (12 of the 17 teams are above .500).

One group, on the other hand, has been much more stable throughout both seasons. The numbers of the 28 relievers from last year, this year pre-trade and this year post-trade have been virtually indistinguishable.

A year ago, 91 players were dealt mid-season. Together, the 44 position players’ stats were pretty similar prior to (.709 OPS, 15.1 HR and 1.1 WAR per 600 plate appearances) and following (.720, 16.8, 1.4) their trades. Ditto for the 13 starting pitchers (3.43 ERA, 1.2005 WHIP, .500 winning percentage before; 3.91, 1.2323, .534 after). As a whole, teams in 2015 got what they had expected from their trades.
For whatever reason, that has rarely been the case in 2016.
In the big picture that is a ballplayer’s career, it is certainly true that a month or two of data is a small sample size. But contending teams make trades specifically with the short term in mind; win while you’re in a position to do so, and worry about next year when you get there. As the baseball season enters September, there isn’t a lot of time left for the players above to find their footing and give their teams the value they thought they had traded for.
(All stats via Baseball Reference through August 28.)
(photo by Keith Allison)


